


This home office in Churchlands runs almost entirely on its own solar. Here’s what six days of real AlphaESS data actually shows – and what it means for your power bill.
Most solar articles talk in theory. This one talks in data. Over six consecutive days in July, we tracked a real solar-and-battery system quietly doing its job on a rooftop in Churchlands, in Perth’s western suburbs. No special conditions, no cherry-picked sunny week – just an ordinary run of WA winter days, including one wet, grey, miserable one thrown in to keep things honest.
The result is one of the clearest illustrations we’ve seen of why a battery set up for self-consumption changes the entire economics of rooftop solar. Across the six days, the household generated the equivalent of roughly 93% of everything it used – and because the system is configured to keep that energy at home rather than dump it to the grid, its reliance on Synergy shrank to a trickle.
This is a working home office. The family is around during the day, which pushes daytime power use higher than an empty house – and that turns out to be exactly the point. Let’s walk through the system, the terms on the app, and then the six days of numbers one at a time.
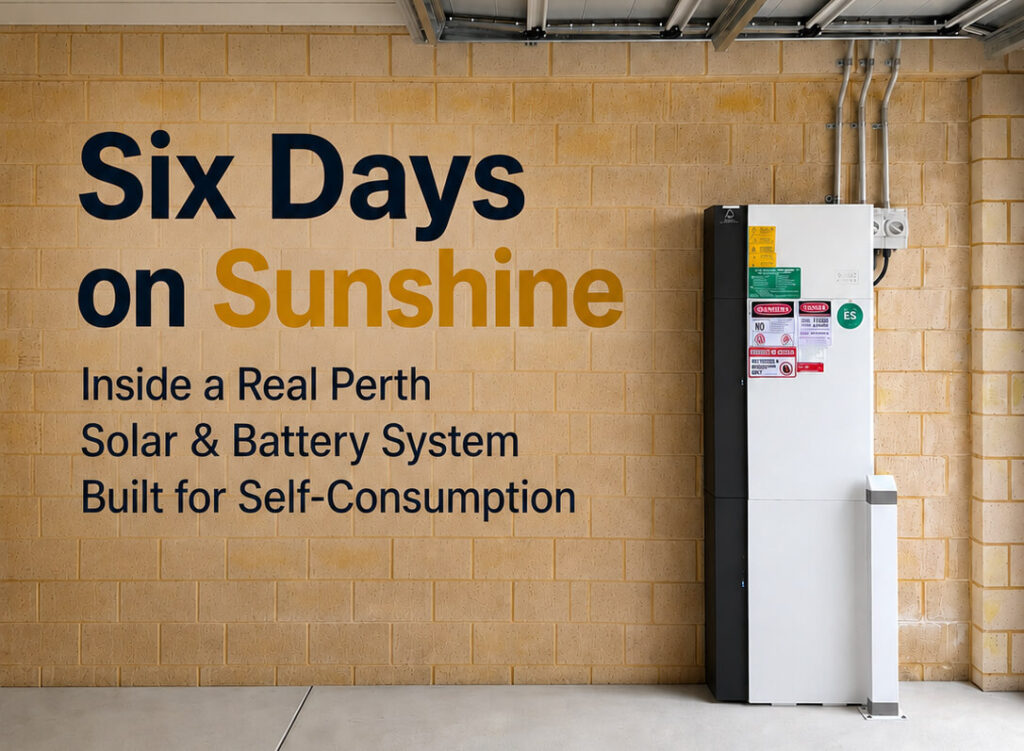
The system at a glance
The home in this case study runs a compact but capable setup:
- Inverter: AlphaESS Smile G3 S5 – a single-phase hybrid inverter (5 kW nominal output, dual MPPTs, up to 10 kWp of solar input) with built-in UPS backup switching for blackout protection.
- Battery: 21.16 kWh of AlphaESS storage – enough to carry the household through the evening and overnight on stored solar.
- Location: Churchlands, Western Australia (Perth metro, Synergy network).
- Mode: Self-consumption – the system prioritises using and storing the home’s own solar before anything is sent to the grid.
- Backup reserve: The battery is held to a minimum reserve of around 10% at all times. Because the household runs a home office and needs power continuity, that reserve is kept in the tank so the UPS can ride through a grid outage.
If you’re weighing up a similar setup, our home battery installation and residential solar pages cover how we size systems to a household’s actual usage – which, as you’ll see below, is the whole game.
Why self-consumption is the whole point in WA
To understand why this system is set up the way it is, you have to understand what Western Australia pays you for exported solar – and what it charges you to buy power back.
Under Synergy’s Distributed Energy Buyback Scheme (DEBS), solar exported to the grid earns just 2 cents per kilowatt-hour between 9pm and 3pm, and 10 cents per kilowatt-hour during the 3pm–9pm peak window. The problem is obvious once you picture a typical solar day: your panels generate the most at midday – squarely inside the 2-cent window. So the energy you have the most of is worth the least.
Now flip it around. The power you buy from Synergy costs many times more than 2 cents a unit. Every kilowatt-hour you can generate, store, and use yourself is a kilowatt-hour you don’t have to buy at the full import rate. That gap – between a 2-cent export credit and a much higher import price – is where a self-consumption battery earns its keep.
So the objective of this system is simple: minimise what you export at rock-bottom rates, and maximise what you consume from your own roof and battery. A battery is what makes that possible, because it lets you time-shift your midday surplus into the evening when you’d otherwise be buying from the grid.
Reading the graphs: what each line actually means
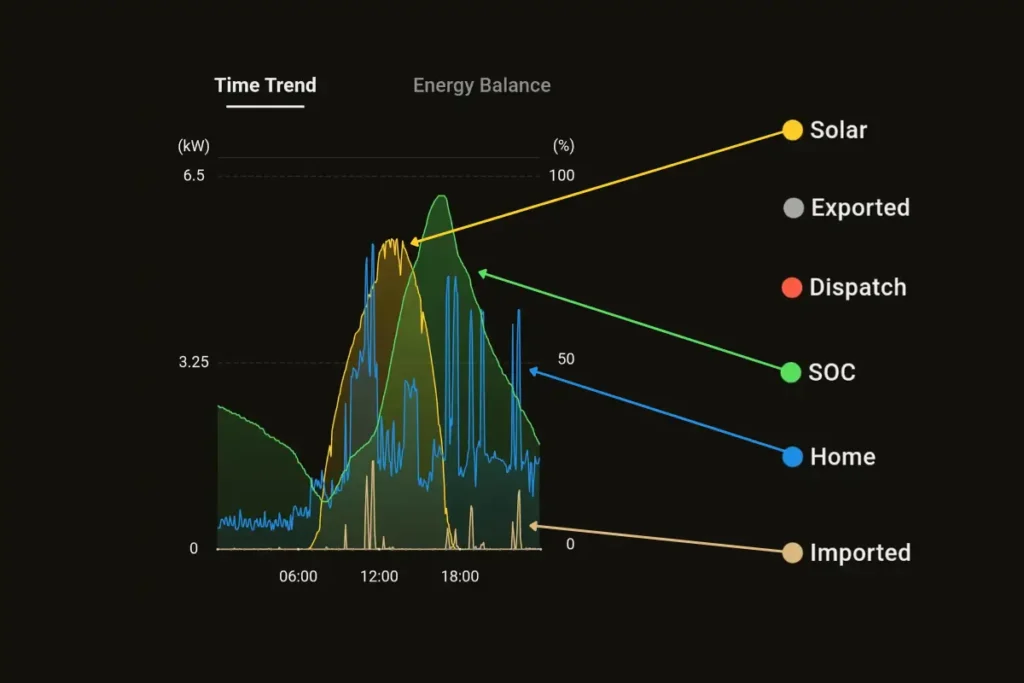
Every screenshot in this article comes from the AlphaESS app’s daily “Time Trend” view. Before we read the days, here’s a plain-English guide to the coloured lines and the terms behind them.
Solar (PV) – the yellow line
This is the power your solar panels are producing at any moment. It climbs after sunrise, peaks around the middle of the day, and fades in the late afternoon. On a clear day it forms a tall, smooth arc; on a cloudy day it’s jagged and much lower.
Home / Load – the blue line
This is what the household is actually using in real time – every appliance, the home office, the kettle, the aircon. It’s spiky by nature because loads switch on and off. This power can be supplied by solar, by the battery, by the grid, or by a combination.
SOC (State of Charge) – the green line
SOC is how full the battery is, shown as a percentage against the right-hand axis. 100% is full; the flat floor at around 10% is the backup reserve this household keeps for blackout protection. Watching the green line is the easiest way to see the system working: it rises through the day as surplus solar charges the battery, then tapers down through the evening as the home draws that stored energy back out.
Imported – the tan line
This is power bought from the grid. On a good solar day with a battery, it barely lifts off the floor – a few small spikes early in the morning or late at night. The smaller this line, the less you’re paying Synergy.
Exported – the grey line
This is surplus solar sent back to the grid at those low DEBS rates. In a self-consumption setup, you actively want this to be small, because every unit exported at 2 cents is a unit you could have stored and used instead.
Dispatch – the red line
This relates to controlled charge/discharge instructions – for example, from a Virtual Power Plant (VPP) program. In this household it stays flat, because the system is simply running its own self-consumption logic.
The daily rhythm of a self-consumption home
Once you know the lines, the same story plays out on every good-weather day. It goes like this.
Overnight and early morning
The house runs on whatever is left in the battery from the day before, down to the 10% reserve. If the battery gets there before sunrise, a small amount of grid power (the tan line) tops up the home until the sun arrives. This is why you’ll often see a little imported power in the pre-dawn hours.
Mid-morning: solar overtakes the house
As the sun climbs, the yellow solar line rises past the blue consumption line. The moment solar exceeds what the home is using, the surplus has somewhere to go: it starts charging the battery. You can watch the green SOC line begin its climb.
Midday: filling the tank
Through the middle of the day, solar is comfortably ahead of consumption – even in this home, where a working home office keeps daytime use higher than an empty house would. The battery charges steadily toward full. Only once the battery is full would meaningful export begin, and on these days it rarely got that far into surplus.
Late afternoon: the handover
As the sun fades, solar production drops below the household’s needs – and that’s usually the moment the rest of the family arrives home, pushing consumption up further. Instead of buying that evening power from the grid, the system switches to drawing down the battery. The green line begins its long taper as stored midday sunshine now runs the evening.
Evening into night
Dinner, screens, lights and the home office wind-down all run on battery power. The grid stays almost entirely out of the picture until the battery approaches its reserve, at which point a small amount of overnight grid power carries the home to the next sunrise – and the cycle repeats.
The contrast with a solar-only home (no battery) is stark. Without storage, that midday surplus gets exported at 2 cents, and then the family buys back expensive grid power all evening at full import rates. The battery is what closes that loop.
Six days of real data
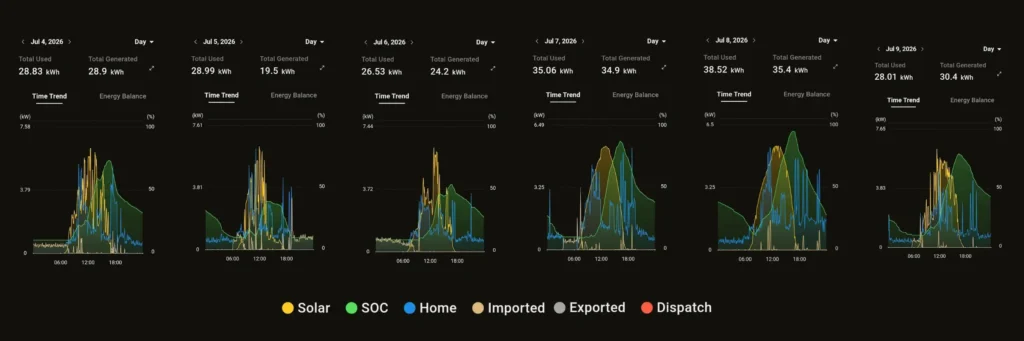
Here’s the week at a glance. These are the headline figures straight from the app – total solar generated and total energy used for each day.
| Date | Generated | Used | What the day looked like |
| Fri 4 Jul | 28.9 kWh | 28.83 kWh | Clear winter day – solar generation matched the home’s consumption almost exactly. |
| Sat 5 Jul | 19.5 kWh | 28.99 kWh | Overcast, rainy day. Lowest solar of the week. Battery only reached ~40% and the grid did more of the lifting. |
| Sun 6 Jul | 24.2 kWh | 26.53 kWh | Mixed cloud. Solar still covered the bulk of the day and charged the battery for the evening. |
| Mon 7 Jul | 34.9 kWh | 35.06 kWh | Strong, clear day. Battery charged toward full and carried the home deep into the night. |
| Tue 8 Jul | 35.4 kWh | 38.52 kWh | Highest household use of the week, yet solar still supplied the equivalent of ~92% of it. |
| Wed 9 Jul | 30.4 kWh | 28.01 kWh | A surplus day – the system generated more than the household used. |
| 6-day total | 173.3 kWh | 185.94 kWh | Solar generated the equivalent of about 93% of everything the home consumed across the week. |
Two things jump out. First, on five of the six days, generation landed within a few percent of consumption – and on 9 July it exceeded it. Second, the one day that broke the pattern, Saturday 5 July, is arguably the most instructive of the lot.
The sunny days: 4, 7, 8 and 9 July
On the clear days, the pattern is textbook. Take 8 July, the highest-consumption day of the week at 38.52 kWh used against 35.4 kWh generated. Despite being the busiest day for the household, solar still produced the equivalent of about 92% of everything the home used. On the graph, the green SOC line climbs a tall arc toward full through the afternoon, then tapers gracefully into the evening as the battery runs the house. The tan import line barely registers, and there’s almost nothing exported. That’s the signature of a home getting the maximum value from every panel.
On 9 July, the system tipped into surplus – 30.4 kWh generated against 28.01 kWh used. A day like this shows the ceiling of what the current system captures: once the battery is full and the home’s needs are met, additional solar has nowhere to go but the grid. For a household considering an even larger battery (or EV charging), days like this are where extra storage would soak up energy that’s currently exported at 2 cents.
4 July (28.9 generated / 28.83 used) and 7 July (34.9 / 35.06) are the quiet achievers – near-perfect balance between what the roof made and what the home used, with the battery bridging the gap between midday generation and evening demand.
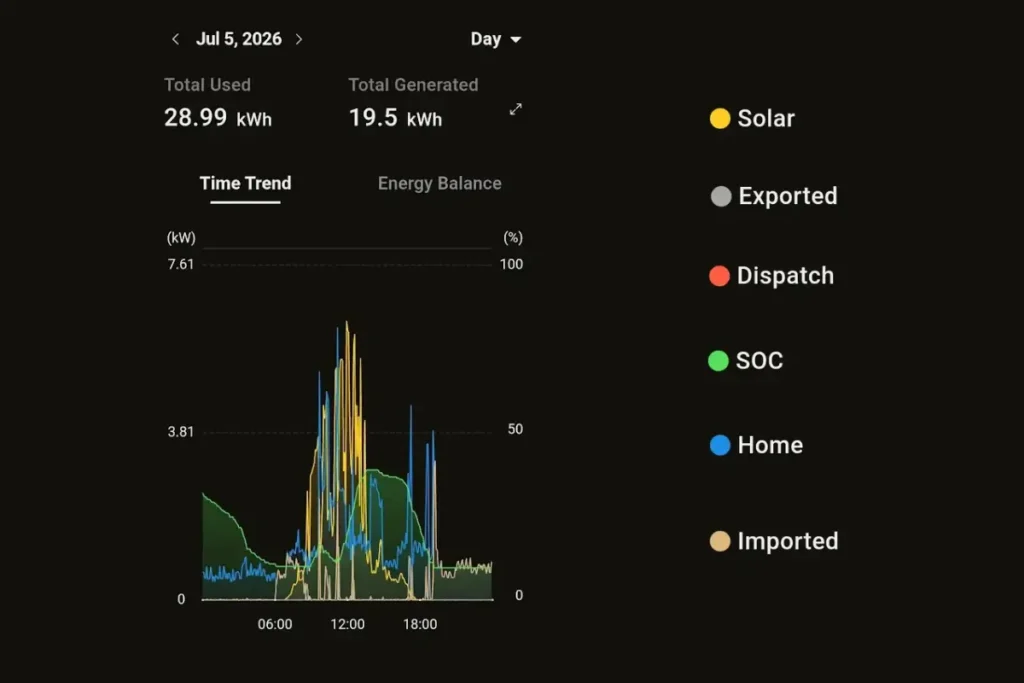
5th July, when the weather didn’t cooperate
Saturday 5 July was overcast, wet and grey – a proper Perth winter’s day. The solar line tells the story: instead of a tall smooth arc, it’s a low, jagged ridge. The system generated just 19.5 kWh, well under the 28.99 kWh the household used.
Here’s what makes this day valuable. The battery started the morning at its 10% backup reserve – the floor the household deliberately keeps for blackout protection. With so little sun, the battery could only charge to around 40% before the light faded, and then tapered off from there. Because there was less stored energy to lean on, the grid did more of the work, and you can see more imported power across the day.
This is exactly how the system is supposed to behave. A battery is not a magic wand that eliminates the grid – it’s a buffer that captures and shifts whatever solar is available. On a brilliant day it captures a lot; on a dark, rainy day it captures what it can and lets the grid quietly fill the rest. Even on this worst day of the week, self-consumption still meant the family used every usable kilowatt the roof produced before buying anything. And notably, household consumption barely changed between the sunny and cloudy days – the weather affects supply, not the family’s needs.
What the week actually proves
Add the six days together and the household generated 173.3 kWh of solar against 185.94 kWh of consumption. In other words, the roof produced the equivalent of roughly 93% of everything the home used – across a winter week that included a washout.
Now, generation isn’t the same as self-consumption: a little of that solar is exported, and a little grid power is imported, so the home isn’t literally 93% grid-free. But because the system runs on self-consumption with a sizeable battery, the shape of the week is unmistakable – very little energy left for the grid at 2 cents, and very little bought back at full price. The grid became a top-up service, not the main supply.
For a home office that’s occupied all day, this is the ideal outcome. Counter-intuitively, being home during the day helps. A house that’s empty from 8am to 5pm generates its biggest solar surplus at exactly the time nobody’s there to use it – so it exports the lot at 2 cents and then buys expensive power when everyone returns. A home office consumes that midday solar directly, live, at the moment it’s cheapest to produce. The battery then handles the evening. Higher daytime use, better economics.
Going further: Self-Consumption Plus and the EV angle
The setup in this case study runs on standard self-consumption, and for this household it’s close to optimal. But for homes with larger batteries – or bigger evening and overnight demands like electric vehicles – there’s a more advanced strategy worth knowing about: Self-Consumption Plus.
In this mode, the system still prioritises your own solar, but if the day’s sunshine isn’t enough to fully charge a large battery, it can also top the battery up from the grid – and it can be scheduled to do that at the cheapest times of day. Paired with the right time-of-use tariff, this is where the numbers get genuinely powerful.
A good WA example is Synergy’s EV Add-On plan, which has a Super Off-Peak window in the middle of the day at just over 8 cents per unit. A household that works away from home can let solar and cheap daytime grid power fill the battery to the brim, arrive at the expensive 3–9pm peak with a full tank, and run the whole evening on stored energy – never touching the 53-cent peak rate. Later, once the low overnight rate kicks in, the system can recharge the battery and top up the car for the next day.
We’ve written a full breakdown of how solar, a battery and the EV Add-On plan work together to slash both power and fuel bills in Tired of $2.60 Petrol? How Smart WA Homeowners Are Breaking Free from the Bowser. If you’re running – or thinking about – an EV, that’s the companion piece to this one. We also handle EV charger installation as part of the same system so the whole thing is designed to work together.
Is a self-consumption battery right for your home?
The honest answer is that it depends on your usage shape, your roof, and your goals – which is precisely why we design every system around real consumption data rather than a one-size-fits-all package. This Churchlands home works so well because the battery is sized to carry its genuine evening and overnight load, and because the household’s daytime pattern lines up beautifully with when the sun is generating.
A few questions worth asking yourself:
- Are you exporting a lot of midday solar to the grid at low DEBS rates right now? That’s stored value you’re giving away.
- Does your power use spike in the evening, after the sun has gone? That’s the classic case a battery solves.
- Do you need power continuity – a home office, medical equipment, or simply peace of mind during outages? A reserve-backed battery with UPS switching covers it.
- Are you running, or planning, an EV? That changes the sums again, usually in favour of more storage and a time-of-use tariff.
If any of those ring true, it’s worth a proper look. The DMG Solar team can review your Synergy bills and usage pattern and design a solar-and-battery system matched to your household – the same way this one was. Request an obligation-free quote or call us on (08) 6185 0478, and we’ll help you work out your ideal setup. You can also browse more real installs on our installations page.
About the Author

Darren Magennis Head of Operations DMG Solar & Electrical
Licensed electrician with over 17 years’ experience in solar power, electrical installations, and residential energy management across Western Australia. Darren has been designing and installing solar and energy systems since 2014, and cofounded DMG Solar in 2021 to bring that experience directly to WA homeowners.

Ready to Get Started?
Drop us a line or fill out our quote form and we will be in touch for an obligation free Quote
DMG Solar & Battery Services
DMG Solar provides a superior service which overall adds value to your property.


Join Thousands of WA HomeownersBook Your Free Consultation
See why more families are choosing DMG Solar for trusted installations.
Trusted by TheLeading Brands